Navigation: Tools → Dashboard
Dashboards are designed to help users track the company’s and users’ real time performance. Various information, from detailed performance of each user or single account up to campaigns or projects in general, are shown in many graphs and other possible visual displays.
Find your way around Dashboard
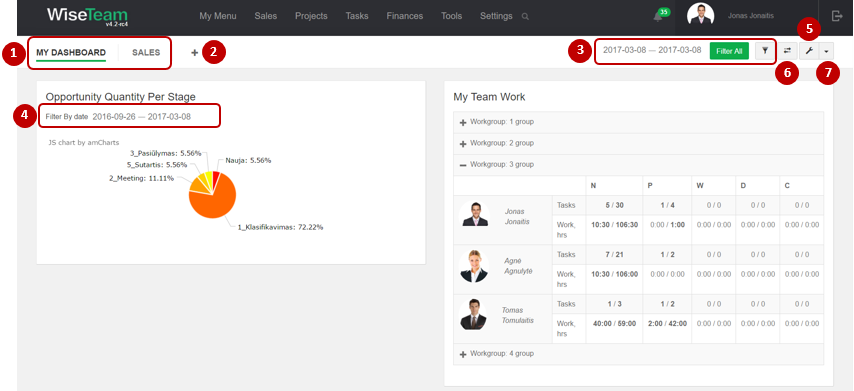
1. Usable Dashboards are seen in line below the general menu panel.
2. There is a possibility to create new Dashboards by clicking ![]() button.
button.
3. There is a possibility to define filter for all filterable widgets. Note: not all widgets are filterable.
4. There is a possibility to define separate filters for particular filterable widgets.
5. There is a possibility to edit Dashboards (add / remove possible widgets) by clicking button ![]() . This button also allows to remove unused Dashboards.
. This button also allows to remove unused Dashboards.
6. There is a possibility to reorder widgets by dragging & dropping widgets after clicking button ![]() .
.
7. There is a possibility to reorder Dashboards (change sequence) by clicking ![]() and selecting Reorder dashboards.
and selecting Reorder dashboards.
Create new Dashboard
It is possible to create several Dashboards that provide different information by adding different widgets. To create new Dashboard from possible widgets follow these steps:
1. Go to Tools → Dashboard.
2. Click ![]() .
.
3. Fill in title of the Dashboard and click Save.
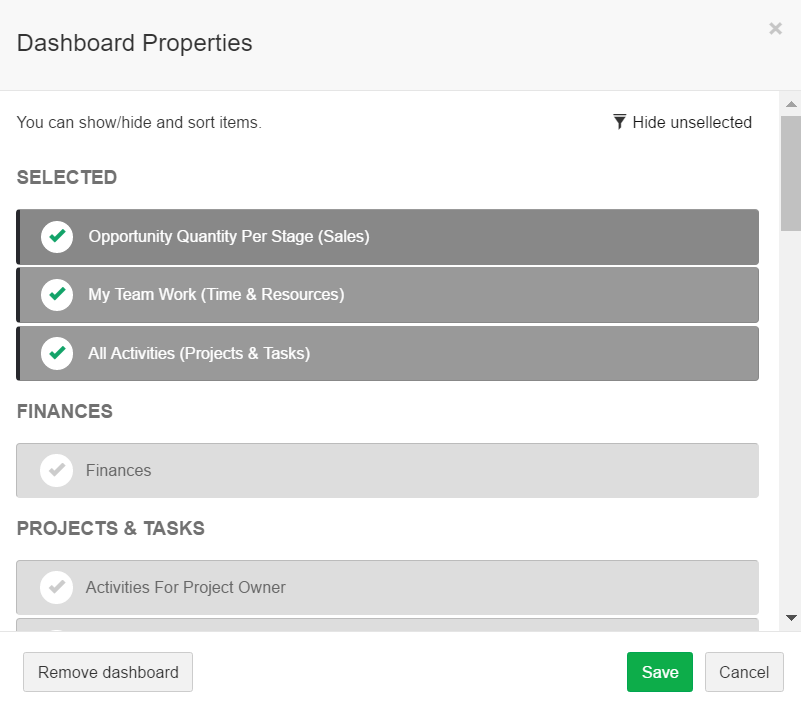
4. Click ![]() button, check widgets that you need and define the sequence of the widgets by dragging them up or down.
button, check widgets that you need and define the sequence of the widgets by dragging them up or down.
5. Click Save.
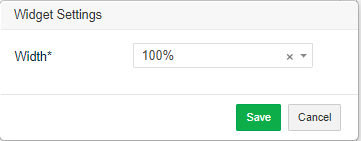
It is possible to change the arrangement of the Dashboard by changing widgets width. To change width of the widgets follow these steps:
1. Click settings button ![]() on the upper right corner of the widget.
on the upper right corner of the widget.
2. Choose width of the widget (percentage of the window width).
3. Click Save.
Available widgets
Widgets that can be added to the dashboard:
FINANCES
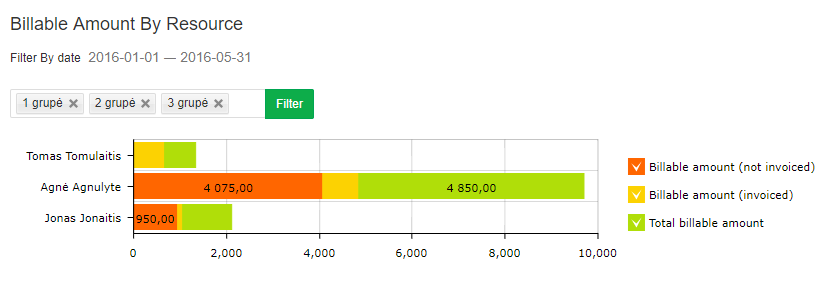
- Billable Amount by Resource: provides visual representation of users and their billable amounts information for a selected period of time and work group.This widget shows:
- Billable Amount (Not Invoiced), which is a sum of Time Records Billable Amount where Billable Status is Not Invoiced, excluding Time Records related to Primary Account projects.
- Billable Amount (Invoiced), which is a sum of Time Records Billable Amount where Billable Status is Invoiced, excluding Time Records related to Primary Account projects.
- Total Billable Amount, which is a sum of Billable Amount (Not Invoiced)and Billable Amount (Invoiced) column.
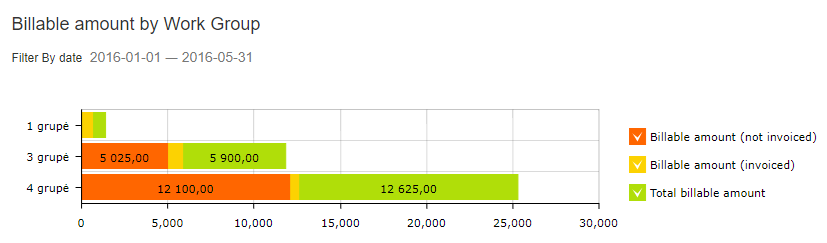
- Billable Amount by Workgroup: provides visual representation of users workgroup and their billable amounts information for a selected period of time.This widget shows:
- Billable Amount (Not Invoiced), which is a sum of Time Records Billable Amount where Billable Status is Not Invoiced, excluding Time Records related to Primary Account projects.
- Billable Amount (Invoiced), which is a sum of Time Records Billable Amount where Billable Status is Invoiced, excluding Time Records related to Primary Account projects.
- Total Billable Amount, which is a sum of Billable Amount (Not Invoiced)and Billable Amount (Invoiced) column.
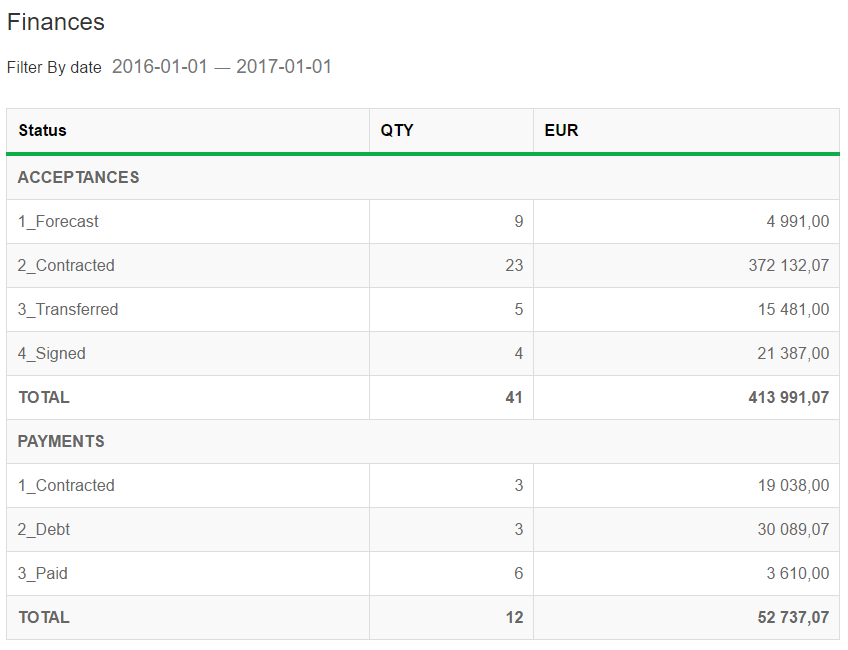
- Finances: provides information of issued Acceptance certificates and created Payments for a selected period of time. More information is being shown after clicking status field.
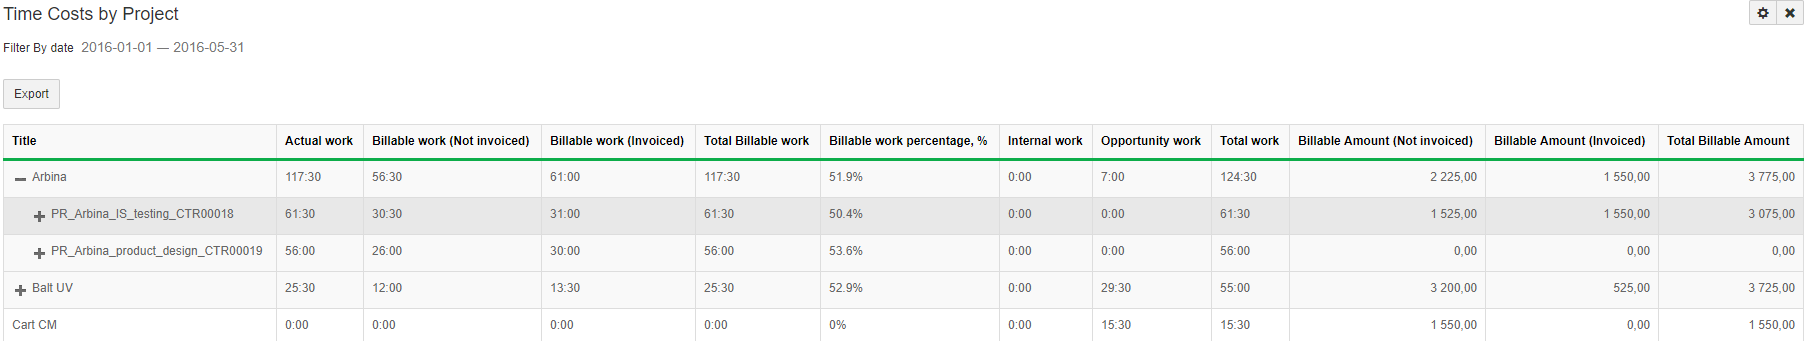
- Time Costs by Project: provides a list of accounts and their time costs information for a selected period of time. There is a possibility to export data to MS Excel.This widget shows:
- Actual work, which is a sum of Time Records field Actual work, excluding Time Records related to Primary Account projects.
- Billable work (Not Invoiced), which is a sum of Time Records Billable work where Billable Status is Not Invoiced, excluding Time Records related to Primary Account projects.
- Billable work (Invoiced), which is a sum of Time Records Billable work where Billable Status is Invoiced, excluding Time Records related to Primary Account projects.
- Total Billable work, which is a sum of Billable work (Not Invoiced) and Billable work (Invoiced) columns.
- Billable work percentage, which shows a percentage of d Billable work (Invoiced) from Actual work.
- Internal work, which is a sum of Time Records field Actual work related to Primary Account projects.
- Opportunity work, which is a sum of Time Records field Actual work related to Opportunities.
- Total work, which is a sum of Actual work, Internal work and Opportunity work columns.
- Billable Amount (Not Invoiced), which is a sum of Time Records Billable Amount where Billable Status is Not Invoiced, excluding Time Records related to Primary Account projects.
- Billable Amount (Invoiced), which is a sum of Time Records Billable Amount where Billable Status is Invoiced, excluding Time Records related to Primary Account projects.
- Total Billable Amount, which is a sum of Billable Amount (Not Invoiced)and Billable Amount (Invoiced) column.
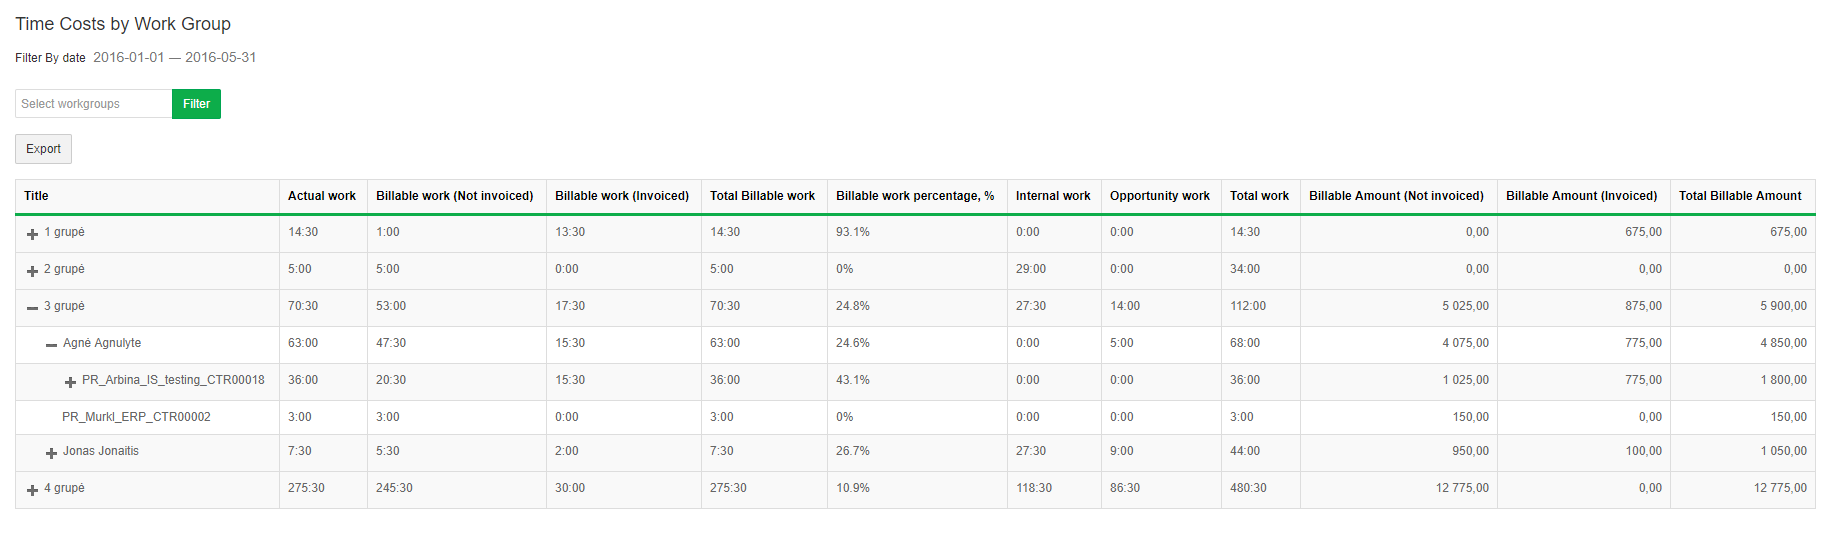
- Time Costs by Work Group: provides a list of users and their time costs information for a selected period of time and work group. There is a possibility to export data to MS Excel.This widget shows:
- Actual work, which is a sum of Time Records field Actual work, excluding Time Records related to Primary Account projects.
- Billable work (Not Invoiced), which is a sum of Time Records Billable work where Billable Status is Not Invoiced, excluding Time Records related to Primary Account projects.
- Billable work (Invoiced), which is a sum of Time Records Billable work where Billable Status is Invoiced, excluding Time Records related to Primary Account projects.
- Total Billable work, which is a sum of Billable work (Not Invoiced) and Billable work (Invoiced) columns.
- Billable work percentage, which shows a percentage of d Billable work (Invoiced) from Actual work.
- Internal work, which is a sum of Time Records field Actual work related to Primary Account projects.
- Opportunity work, which is a sum of Time Records field Actual work related to Opportunities.
- Total work, which is a sum of Actual work, Internal work and Opportunity work columns.
- Billable Amount (Not Invoiced), which is a sum of Time Records Billable Amount where Billable Status is Not Invoiced, excluding Time Records related to Primary Account projects.
- Billable Amount (Invoiced), which is a sum of Time Records Billable Amount where Billable Status is Invoiced, excluding Time Records related to Primary Account projects.
- Total Billable Amount, which is a sum of Billable Amount (Not Invoiced)and Billable Amount (Invoiced) column.
PROJECTS & TASKS
- Activities For Project Owner: provides a list of activities related to Projects to which user is assigned as Project owner. This widget shows:
- Days to planned Activity start deadline (the first letter in column Due in is S) and days to planned Activity finish deadline (the first letter in column Due in is F). If Activity is late to start or finish, the number of days is shown in red, if Activity has to start or finish today, the number of days is shown in yellow, if Activity is planned to start or finish in the future comparing to this day, the number of days is shown in green.
- The number of related Tasks with statuses Not started and In progress. There is a possibility to review related Tasks by clicking on their number. There is also a possibility to create new Task by clicking button
 . In this widget there is no possibility to create a Task related directly to the Project.
- Activities for Team Member: provides a list of activities related to Projects to which user is assigned as team member (user is considered to be a Project team member if he is assigned to Project budget or has Tasks related to Project or Project activities). This widget shows:
- Days to planned Activity start deadline (the first letter in column Due in is S) and days to planned Activity finish deadline (the first letter in column Due in is F). If Activity is late to start or finish, the number of days is shown in red, if Activity has to start or finish today, the number of days is shown in yellow, if Activity is planned to start or finish in the future comparing to this day, the number of days is shown in green.
- The number of related Tasks with statuses Not started and In progress. There is a possibility to review related Tasks by clicking on their number. There is also a possibility to create new Task by clicking button . In this widget there is no possibility to create a Task related directly to the Project.
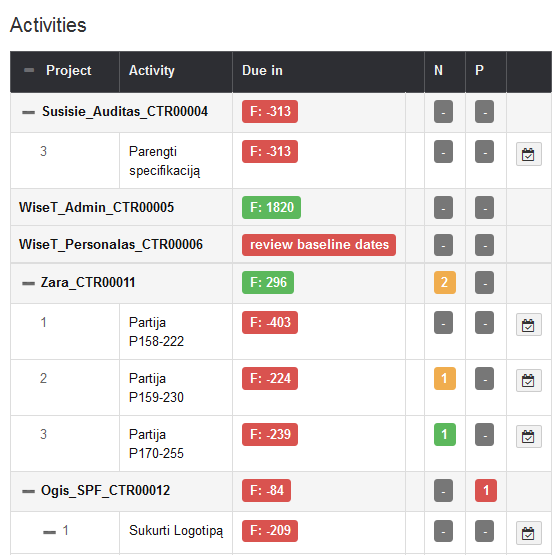
- All Activities: provides a list of all activities related. This widget shows:
- Days to planned Activity start deadline (the first letter in column Due in is S) and days to planned Activity finish deadline (the first letter in column Due in is F). If Activity is late to start or finish, the number of days is shown in red, if Activity has to start or finish today, the number of days is shown in yellow, if Activity is planned to start or finish in the future comparing to this day, the number of days is shown in green.
- The number of related Tasks with statuses Not started and In progress. There is a possibility to review related Tasks by clicking on their number. There is also a possibility to create new Task by clicking button . In this widget there is no possibility to create a Task related directly to the Project.
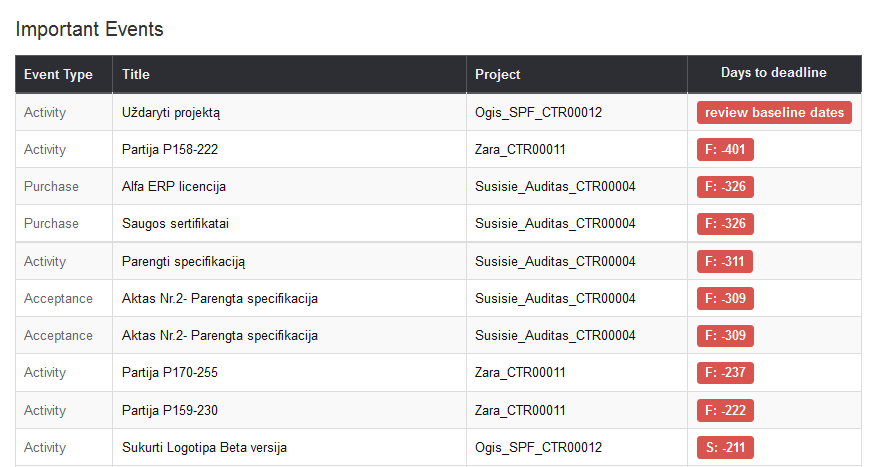
- All Important Events: provides a list of important events related to all Projects. Events provided in this widget:
- Acceptance Certificate. Records which status is Contracted and days to deadline calculated by deducting today’s date from Acceptance Certificate Planned date is less than 14 days are displayed.
- Activity. Records which status is Planned and days to deadline calculated by deducting today’s date from Activity Start date is less than 14 days and records which status is In progress and days to deadline calculated by deducting today’s date from Activity Finish date is less than 14 days are displayed.
- Purchase. Records which status is Not started or In progress and days to deadline calculated by deducting today’s date from Purchase Planned date is less than 14 days are displayed.
- Incident, Risk, Problem. All records which status is Not started or In progress are displayed.
Important events list also provides color indications depended on days to deadline: if event is late to start or finish (days to deadline is less than 0), the number of days is shown in red; if event has to start or finish today, the number of days is shown in yellow; if event is planned to start or finish in the future comparing to this day (days to deadline is greater than 0), the number of days is shown in green. The first letter in column Days to deadline (S or F) shows whether event shows days to event start deadline of event finish deadline.
There is a possibility to open the form of the record by clicking on the event title.
- All Projects: provides a list of all Projects and a percentage of actual work, material resource, expense, duration and revenue values compared to the planned values. Bold formatting of Project title is used to distinguish Projects to which user that is currently logged in is assigned as Project manager.
- Important Events For Project Owner: provides a list of important events related to Projects to which user is assigned as Project owner. Events provided in this widget:
- Acceptance Certificate. Records which status is Contracted and days to deadline calculated by deducting today’s date from Acceptance Certificate Planned date is less than 14 days are displayed.
- Activity. Records which status is Planned and days to deadline calculated by deducting today’s date from Activity Start date is less than 14 days and records which status is In progress and days to deadline calculated by deducting today’s date from Activity Finish date is less than 14 days are displayed.
- Purchase. Records which status is Not started or In progress and days to deadline calculated by deducting today’s date from Purchase Planned date is less than 14 days are displayed.
- Incident, Risk, Problem. All records which status is Not started or In progress are displayed.
Important events list also provides color indications depended on days to deadline: if event is late to start or finish (days to deadline is less than 0), the number of days is shown in red; if event has to start or finish today, the number of days is shown in yellow; if event is planned to start or finish in the future comparing to this day (days to deadline is greater than 0), the number of days is shown in green. The first letter in column Days to deadline (S or F) shows whether event shows days to event start deadline of event finish deadline.
There is a possibility to open the form of the record by clicking on the event title.
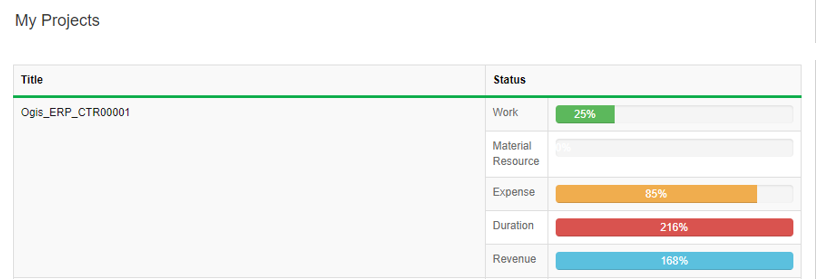
- My Projects: provides a list of active Projects to which user is assigned as Project owner or a team member and a percentage of actual work, material resource, expense, duration and revenue values compared to the planned values.
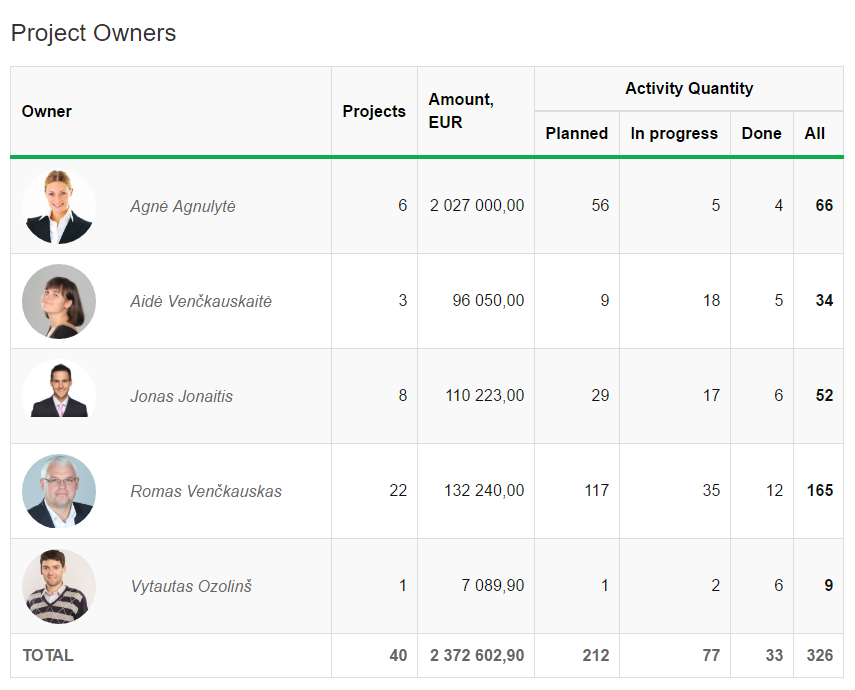
- Project owners: provides a list of all project owners (project managers), the number of Projects and Activities with statuses planned, in progress and done and planned Project’s budget. Detailed Projects and Activities lists are provided after clicking on numbers provided in the table.
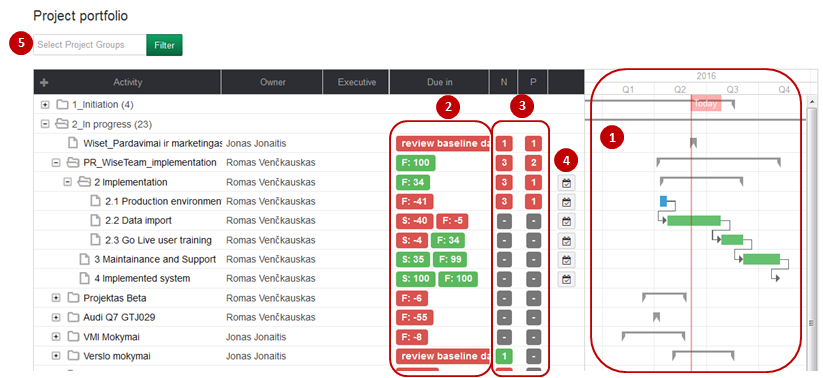
- Project Portfolio: it is a tool for monitoring and controlling multiple Projects. This widget summarizes key information of all Projects company is undertaking that allows to get instant understanding of status and progress of each Project:
- This widget provides a list of all Projects grouped according to their status.
- Gantt chart allows to review the progress of Project activities (1).
- Widget shows days to planned start deadline and days to planned finish deadline of Projects and Activities. If Project or Activity is late to start or finish, the number of days is shown in red, if Activity has to start or finish today, the number of days is shown in yellow, if Activity is planned to start or finish in the future comparing to this day, the number of days is shown in green. Letter in column Due in in front of the number of the days indicates whether number shows days to planned start deadline or days to planned finish deadline (2).
- There is also a possibility to see the number of related Tasks (3). There is a possibility to review related Tasks by clicking on their number. It is possible to create new Task by clicking button (4). In this widget there is no possibility to create a Task related directly to the Project.
- Widget also allows to filter Projects by Project groups (5).
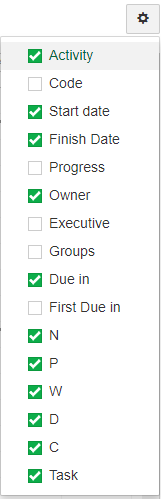
In the project portfolio widget are available these fields
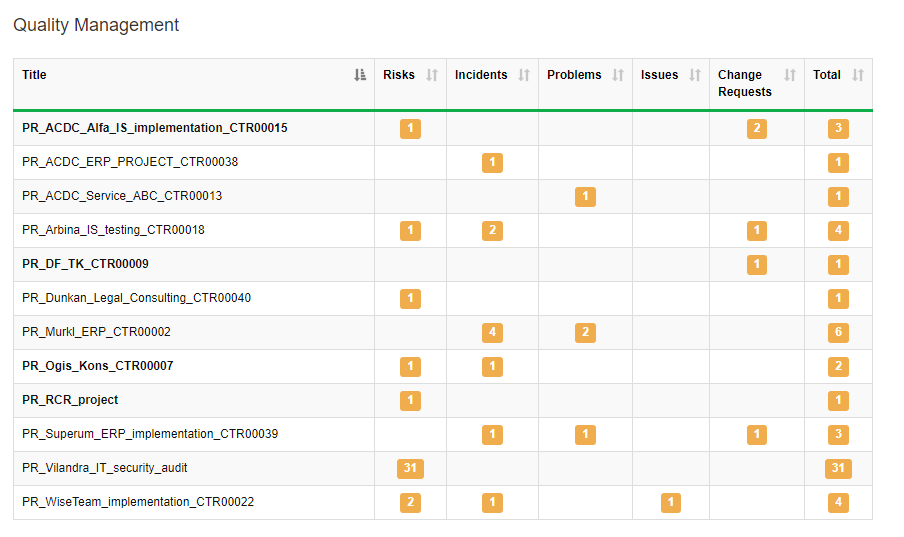
- Quality Management: provides a number of risks, incidents, problems, issues and change requests with statuses Not started and In progress. Colours records according to the status of related tasks. If there is at least one incident, risk, problem, issue, or change request that does not have tasks (not started and in progress) or contains late tasks (not started and in progress), then shading is red. In other cases, the colour is green. There is a possibility to review a list of related risks, incidents, problems, issues or change requests by clicking on the number.
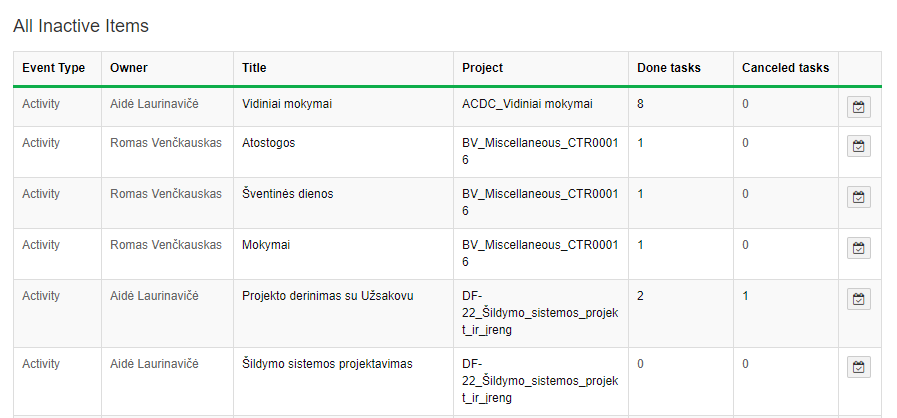
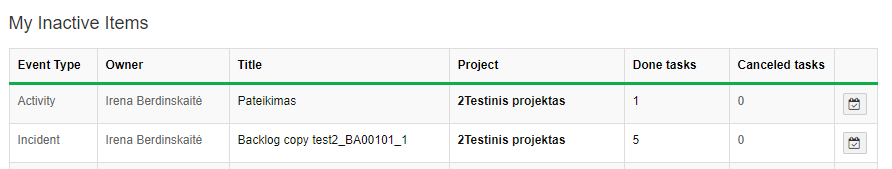
- All Inactive Items and My Inactive Items: these widgets indicates in which object of system haven’t active tasks.
Event Type: indicates in which object of system has not active tasks;
Owner: indicates owner of object;
Title: indicates object name;
Project: indicates relation with project;
Done tasks: indicates how many tasks are with status done;
Canceled tasks: indicates how many tasks are with status canceled.
![]() - function to create for task.
- function to create for task.
SALES
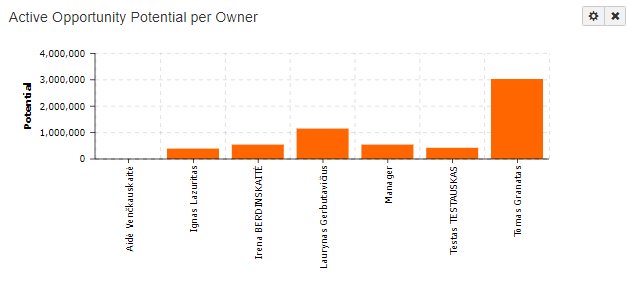
- Active Opportunity Potential Per Owner: provides information of potential receivable amount (counted according to Active Opportunity revenue and probability assigned to Opportunity stage) per Opportunity owner.
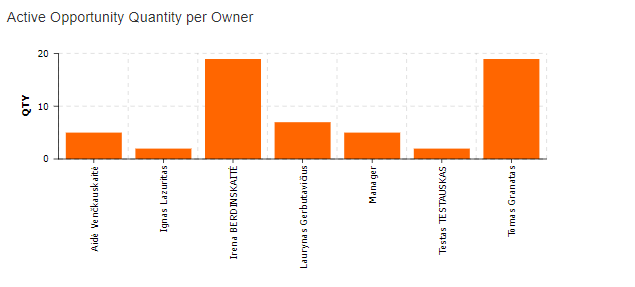
- Active Opportunity Quantity Per Owner: provides the number of active Opportunities per Opportunity owner.
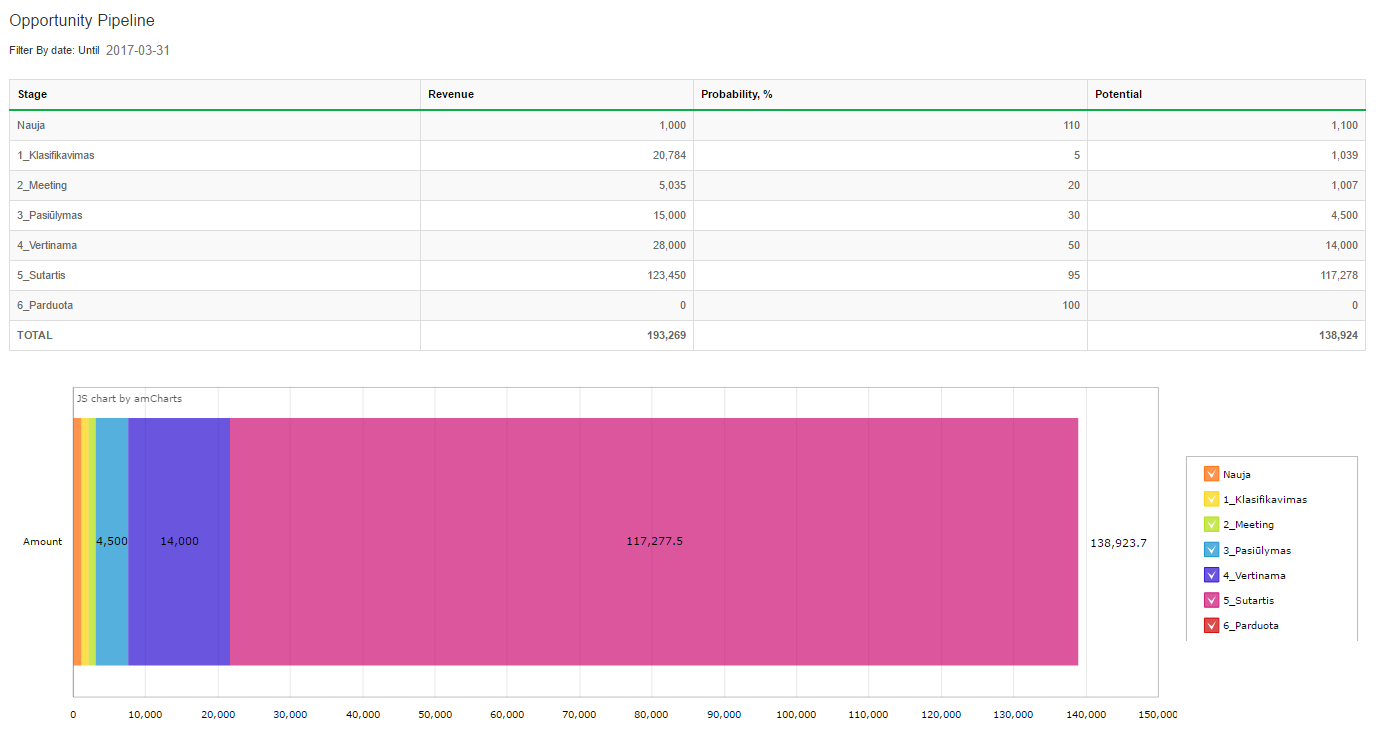
- Opportunity Pipeline: provides visual representation of potential receivable amount according to Opportunity stage (phase in your sales cycle) for a selected period of time. Widget also provides the total sums of estimated Opportunity revenues, probabilities of closure for particular Opportunity stages and potential receivable amounts equal to the sum of the total estimated opportunity revenues in each Opportunity stage multiplied by the probability of closure for that stage.
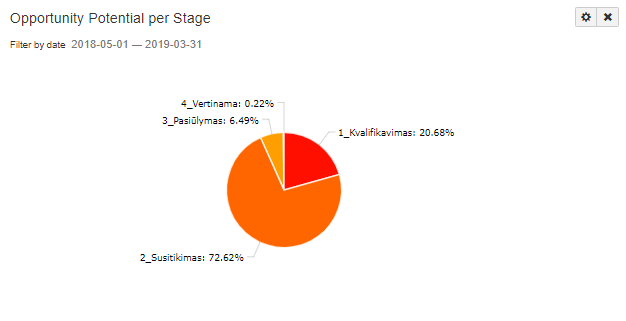
- Opportunity Potential Per Stage: provides information of potential receivable amount (counted according to planned Opportunity revenue and probability assigned to Opportunity stage) per Opportunity stage for a selected period of time.
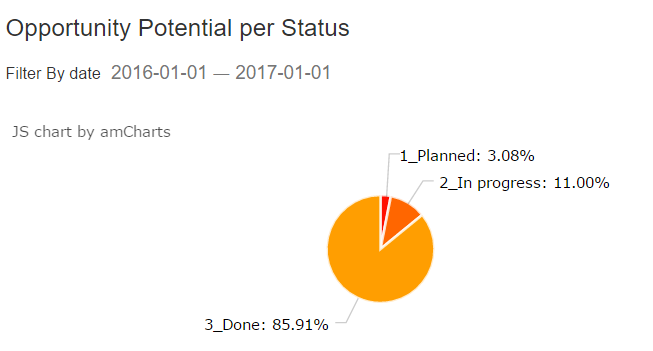
- Opportunity Potential Per Status: provides information of potential receivable amount (counted according to planned Opportunity revenue and probability assigned to Opportunity stage) per Opportunity status for a selected period of time.
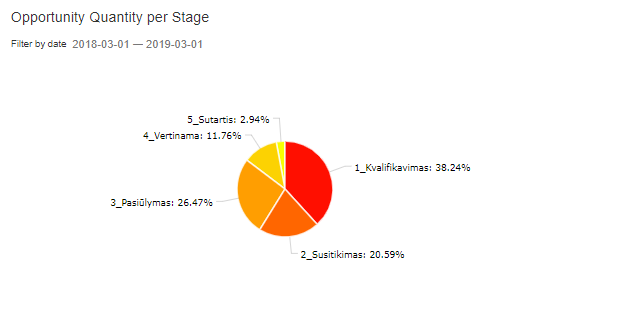
- Opportunity Quantity Per Stage: provides information of Opportunity quantity per Opportunity stage for a selected period of time. While only including current stage of opportunity and only those opportunities who’s Start date falls within the selected period of time in the widget.
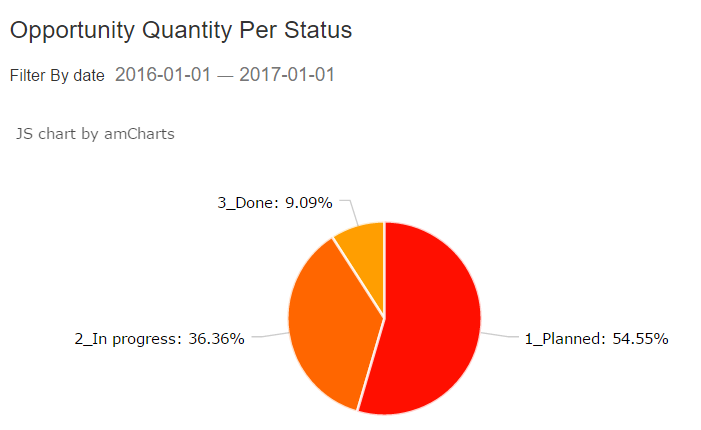
- Opportunity Quantity Per Status: provides information of Opportunity quantity per Opportunity status for a selected period of time.
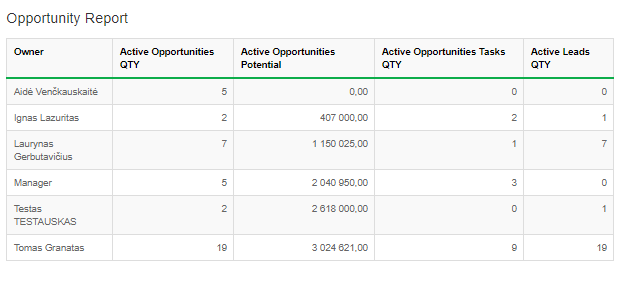
- Opportunity Report: provides the number of active Opportunities, active Opportunities’ potential, tasks assigned to active Opportunities, active Leads and signed projects per owner for a selected period of time.
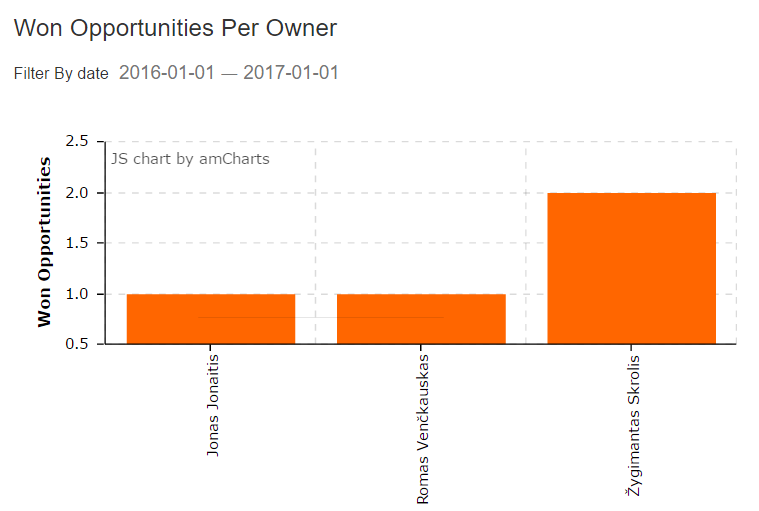
- Won Opportunities Per Owner: provides the number of won Opportunities per Opportunity owner for a selected period of time.
SYSTEM & DATA
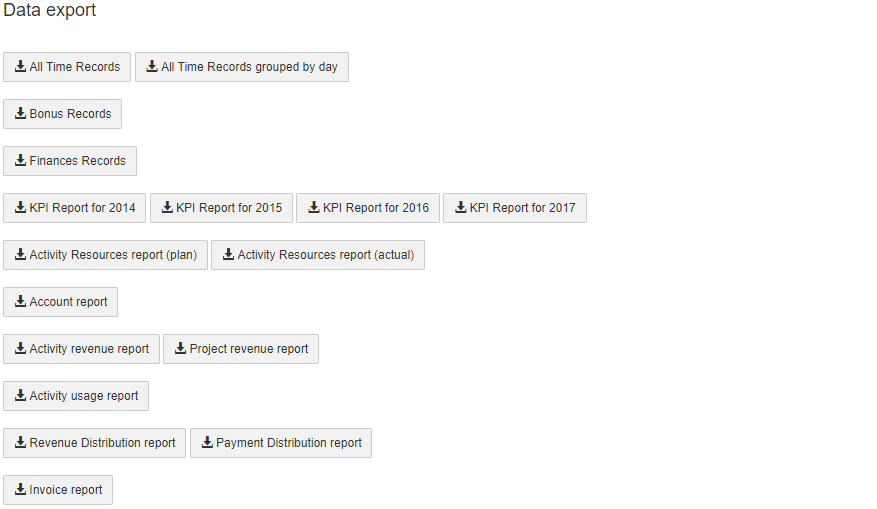
- Data Export: provides possibility to export various data to MS Excel (export all time records, export all time records grouped by day, export all bonus records, export all finances records, export KPI report, etc.) for additional analysis.
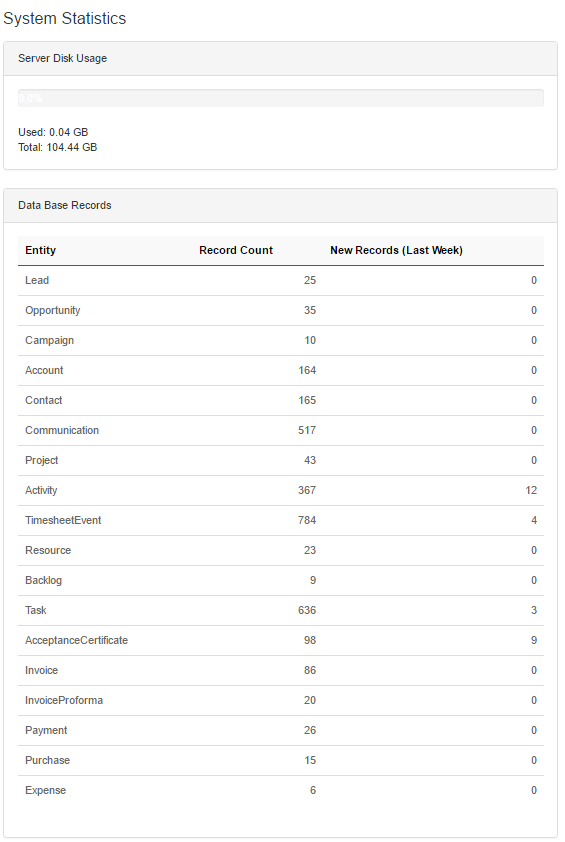
- System Statistics: provides server disk usage information and number of database records.
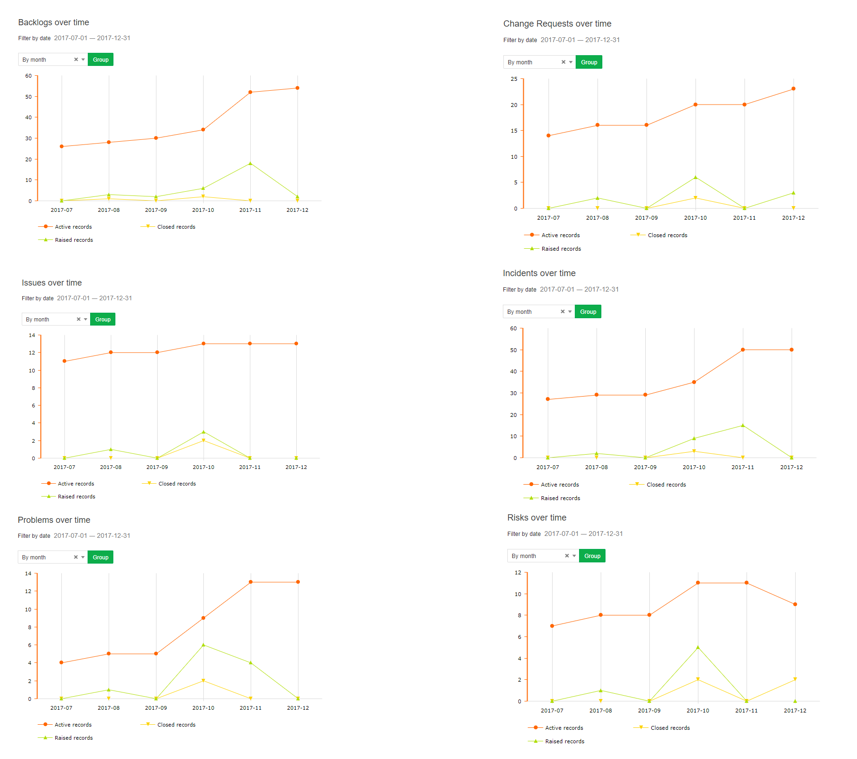
- Records over time: information about risks, incidents, problems, change requests, issues and backlogs time records by week or by month. In the diagrams presented active, raised and closed records in the chosen period.
TIME & RESOURCES
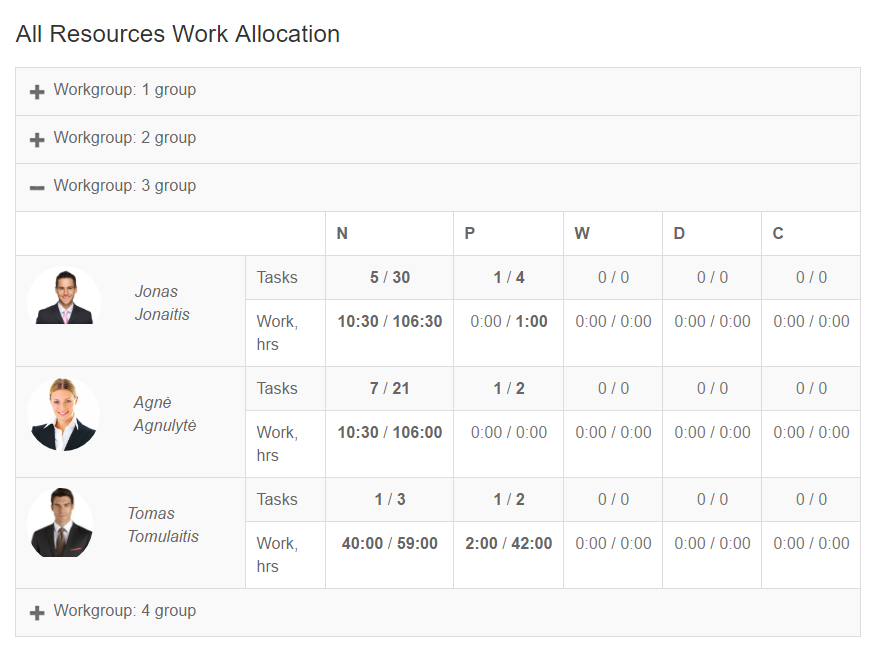
- All Resources Work Allocation: provides work allocation information of all resources. In this widget you can see how many tasks with statuses Not started and In Progress each resource has and how much work hours it will take. The first number shows work allocation in your Projects, the second one shows total tasks and work allocated to the resource. There is a possibility to review in which particular Projects resource is working by clicking on the resource name. Bold formatting is used to distinguish tasks assigned to your Projects.
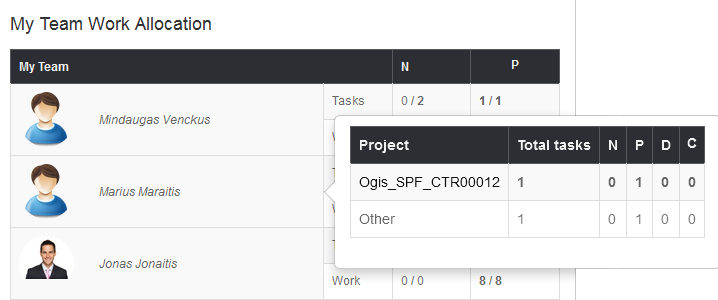
- My Team Work: provides total workload information of resources working in your Projects (of which you are a Project owner). In this widget you can see how many tasks each team member has and how much work hours it will take. The first number shows work allocation in your Projects, the second one shows total tasks and work allocated to the resource.
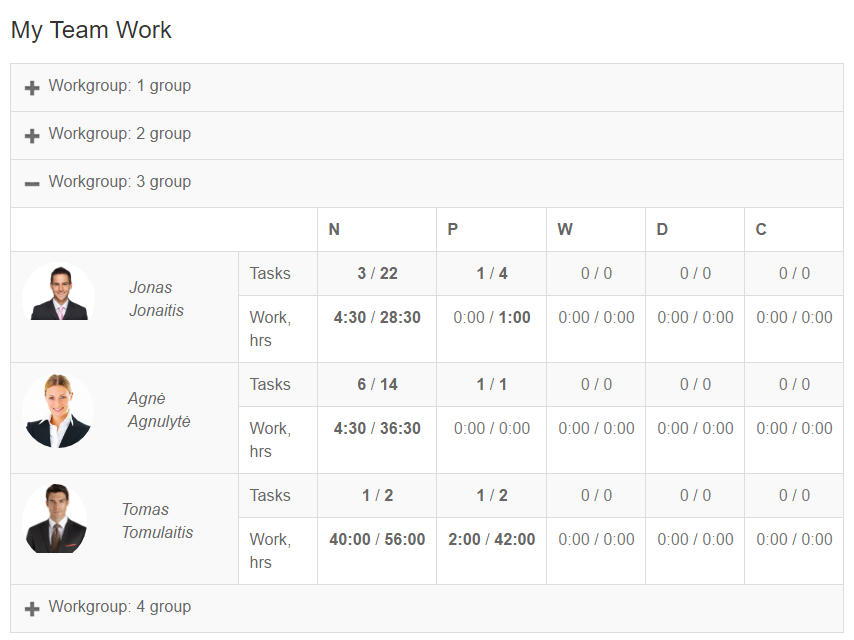
There is a possibility to review in which particular Projects resource is working by clicking on the resource name. Bold formatting is used to distinguish tasks assigned to your Projects.
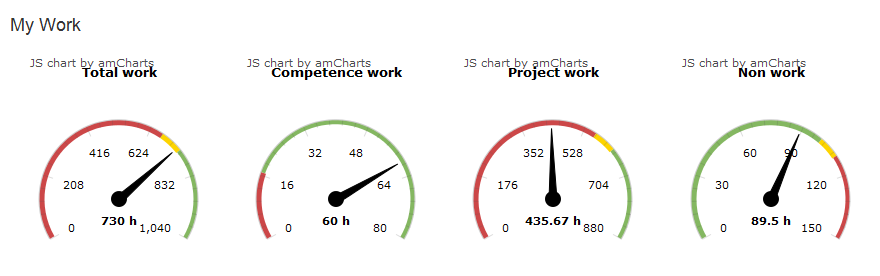
- My Work: provides evaluation of user’s recorded total time, time spent on competence development, time spent working on Projects and non work time according to defined KPIs.
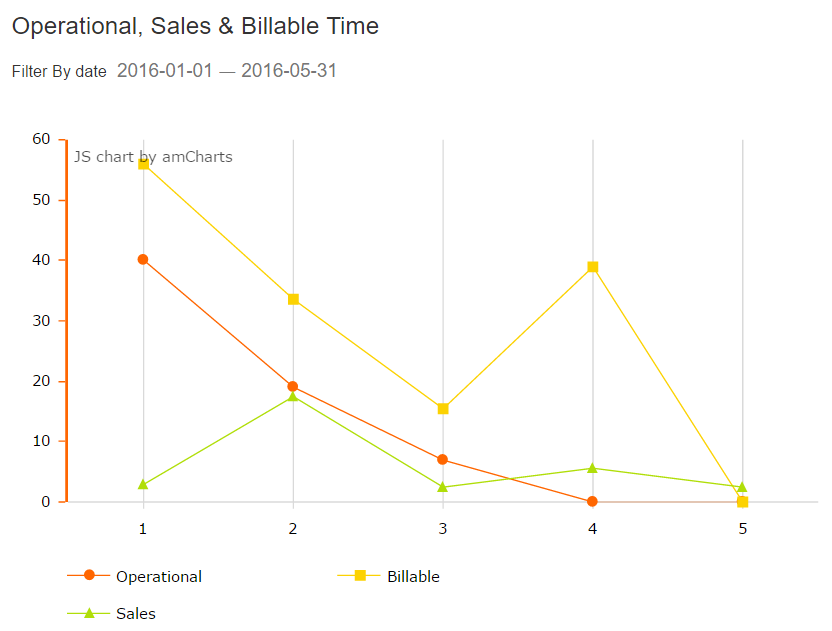
- Operational, Sales & Billable Time: provides visual representation of time spent working on Projects, operational activities and Opportunities. Time is calculated by summing up the duration of all time records with status Approved.
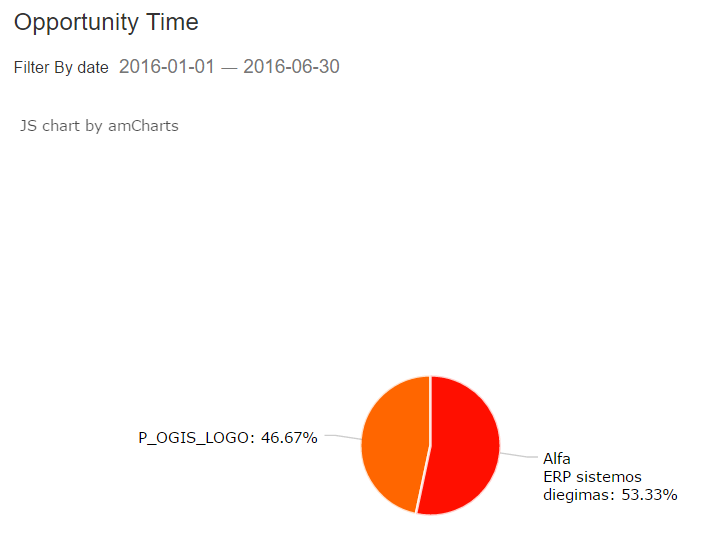
- Opportunity Time: provides information of time spent working on each Opportunity in percentage over a selected period of time. By hovering mouse pointer over an Opportunity title there is a possibility to see both time spent working on Opportunity in hours and in percentage. Time is calculated by summing up the duration of all time records related to Opportunities with status Approved.
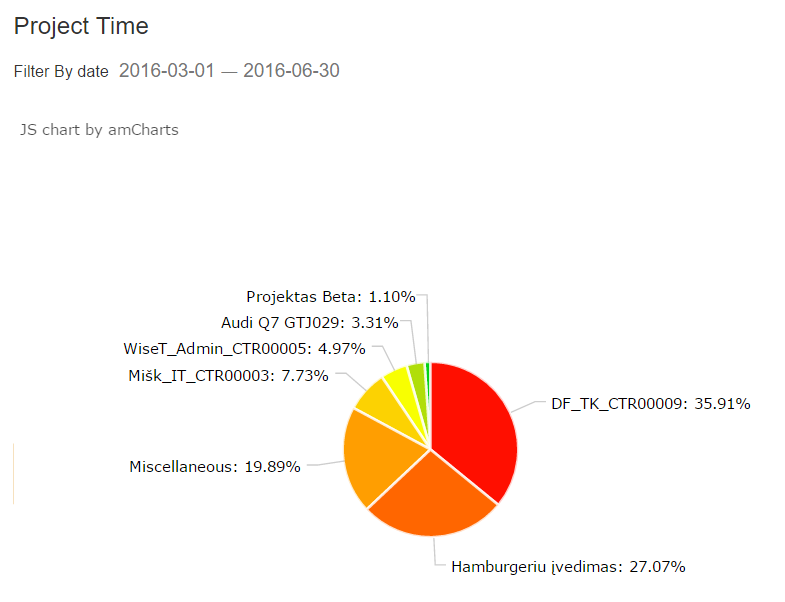
- Project Time: provides information of time spent working on each Project in percentage over a selected period of time. By hovering mouse pointer over a Project title there is a possibility to see both time spent working on Project in hours and in percentage. Time is calculated by summing up the duration of all time records related to Projects with status Approved.
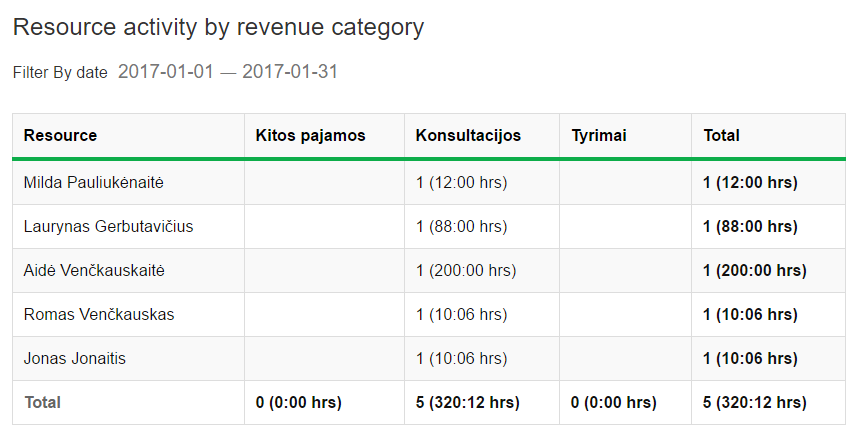
- Resource activity by revenue category: provides resources time by revenue category.
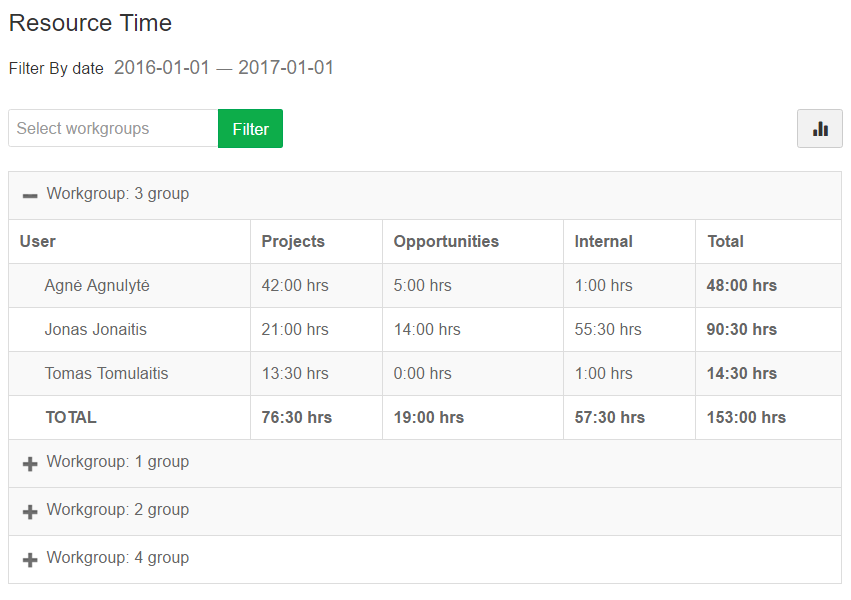
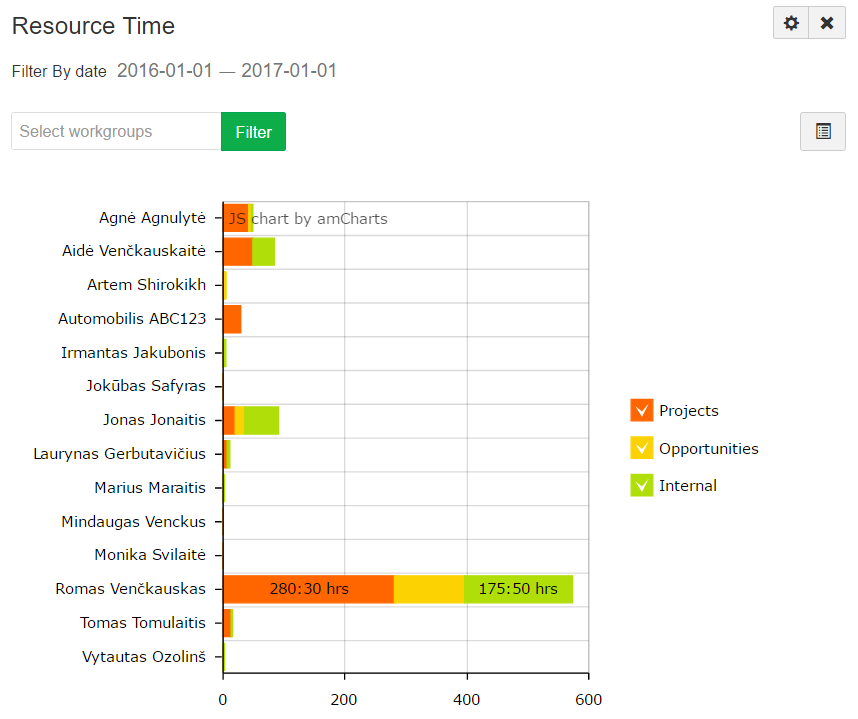
- Resource Time: provides time spent working Projects, Opportunities and Internal activities (operational activities, related to Primary Account projects). Time is calculated by summing up the duration of all time records related to respectively Projects, Opportunities and operational activities regardless of the status. There is a possibility to switch to chart view by clicking
 and switch back to table view by clicking
  .
.
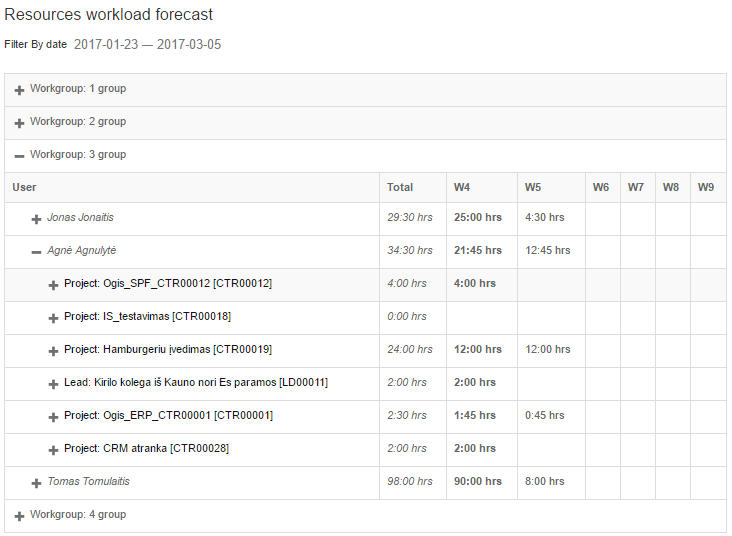
- Resources Workload Forecast: provides a list of all users and their workload for a selected period of time. There is a possibility to review dates of a specific week by clicking on the number of the week.
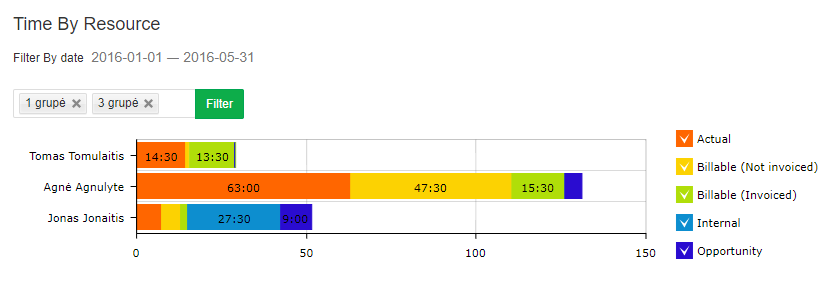
- Time by Resource: provides a visual representation of users and their time information for a selected period of time and work group. This widget shows:
- Actual work, which is a sum of Time Records field Actual work, excluding Time Records related to Primary Account projects.
- Billable work (Not Invoiced), which is a sum of Time Records Billable work where Billable Status is Not Invoiced, excluding Time Records related to Primary Account projects.
- Billable work (Invoiced), which is a sum of Time Records Billable work where Billable Status is Invoiced, excluding Time Records related to Primary Account projects.
- Internal work, which is a sum of Time Records field Actual work related to Primary Account projects.
- Opportunity work, which is a sum of Time Records field Actual work related to Opportunities.
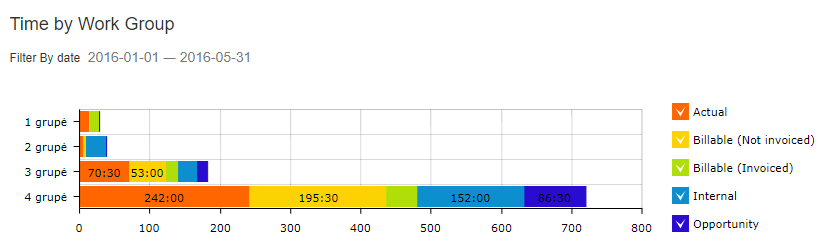
- Time by Work Group: provides a visual representation of users work groups and their time information for a selected period of time. This widget shows:
- Actual work, which is a sum of Time Records field Actual work, excluding Time Records related to Primary Account projects.
- Billable work (Not Invoiced), which is a sum of Time Records Billable work where Billable Status is Not Invoiced, excluding Time Records related to Primary Account projects.
- Billable work (Invoiced), which is a sum of Time Records Billable work where Billable Status is Invoiced, excluding Time Records related to Primary Account projects.
- Internal work, which is a sum of Time Records field Actual work related to Primary Account projects.
- Opportunity work, which is a sum of Time Records field Actual work related to Opportunities.
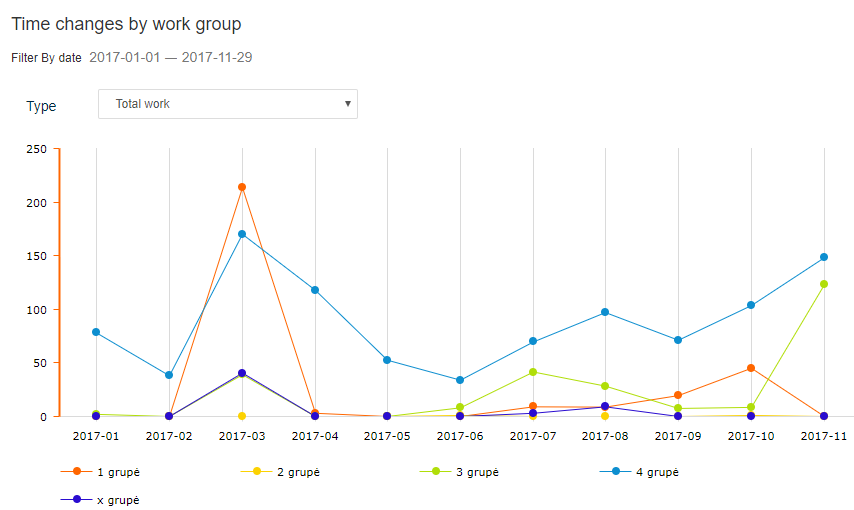
- Time changes by Work Group: provides a visual representation of users work groups and their time costs information for a selected period of time.This widget shows:
- Actual work, which is a sum of Time Records field Actual work, excluding Time Records related to Primary Account projects.
- Billable work (Not Invoiced), which is a sum of Time Records Billable work where Billable Status is Not Invoiced, excluding Time Records related to Primary Account projects.
- Billable work (Invoiced), which is a sum of Time Records Billable work where Billable Status is Invoiced, excluding Time Records related to Primary Account projects.
- Total Billable work, which is a sum of Billable work (Not Invoiced) and Billable work (Invoiced) columns.
- Billable work percentage, which shows a percentage of d Billable work (Invoiced) from Actual work.
- Internal work, which is a sum of Time Records field Actual work related to Primary Account projects.
- Opportunity work, which is a sum of Time Records field Actual work related to Opportunities.
- Total work, which is a sum of Actual work, Internal work and Opportunity work columns.
- Billable Amount (Not Invoiced), which is a sum of Time Records Billable Amount where Billable Status is Not Invoiced, excluding Time Records related to Primary Account projects.
- Billable Amount (Invoiced), which is a sum of Time Records Billable Amount where Billable Status is Invoiced, excluding Time Records related to Primary Account projects.
- Total Billable Amount, which is a sum of Billable Amount (Not Invoiced)and Billable Amount (Invoiced) column.
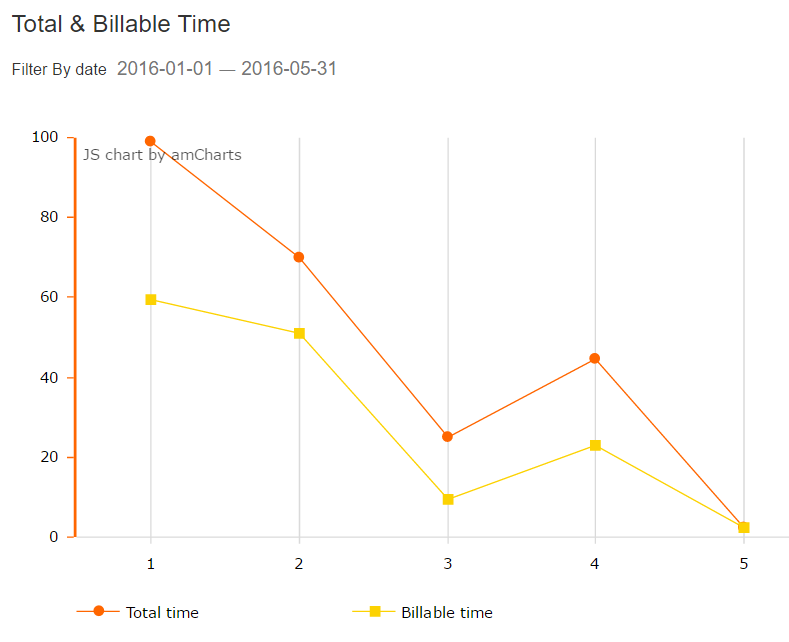
- Total & Billable Time: provides visual representation of total worked time and billable time paid by clients for a selected period of time. Billable time is calculated by summing up the duration of all time records with status Approved of users that labour hours are billable (attribute Billable is assigned) (attribute Billable is assigned in Settings -> Users).